
A conducting loop of finite resistance lies in the x–y plane in a constant magnetic field along z. The area of the loop varies with time as A=A₀(1+ t). The figure that correctly indicates the qualitative behaviour of the power P dissipated in the loop as a function of time is:
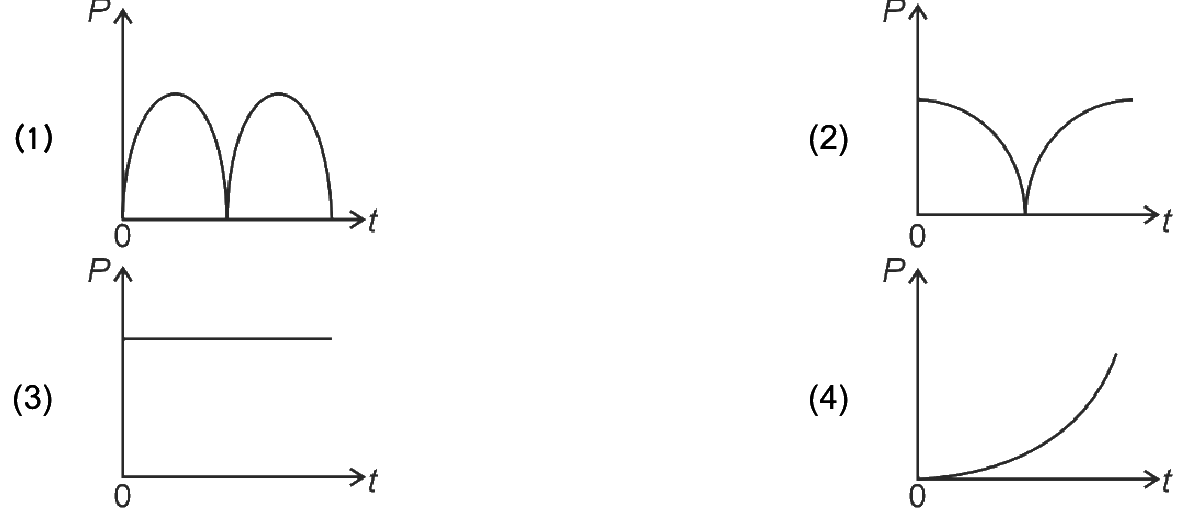
- A.two full positive humps per period (≈ | t| shape)
- B.² t shape — humps that touch zero periodically✓
- C.a constant horizontal line
- D.a monotonically rising curve
Correct Answer
(B) ² t shape — humps that touch zero periodically
Solution & Explanation
Flux through the loop: φ = B·A = B·A₀(1 + sin t) (the area oscillates). Induced emf ε = −dφ/dt = −B·A₀·cos t. Induced current I = ε/R = −(B·A₀/R)·cos t. Power dissipated P = I²R = (B²A₀²/R)·cos²t. So P ∝ cos²t: it is always ≥ 0 (power can't be negative), oscillating between 0 and a maximum. Wherever cos t = 0 (when the rate of area change reverses), the power momentarily drops exactly to zero, so the curve is a series of humps that just touch the time axis periodically. Key point: P depends on cos²t, giving repeated humps that touch zero — this is the cos²t shape, answer (B).
✅ We had this exact concept in our bank before the exam — Concept match, 75% match.
That's the Predicted Batch — it trains you on the exact high-probability concepts NEET repeats every year. 98% of the 2026 paper (176/180) was in our bank before the exam.
Master these concepts + 50,000+ NEET PYQs in the app — free, built for NEET 2027.
Start the Predicted Batch — Free →