
In the Geiger–Marsden experiment, the number of scattered α-particles N(θ) is plotted as a function of scattering angle θ. Which option represents the correct plot?
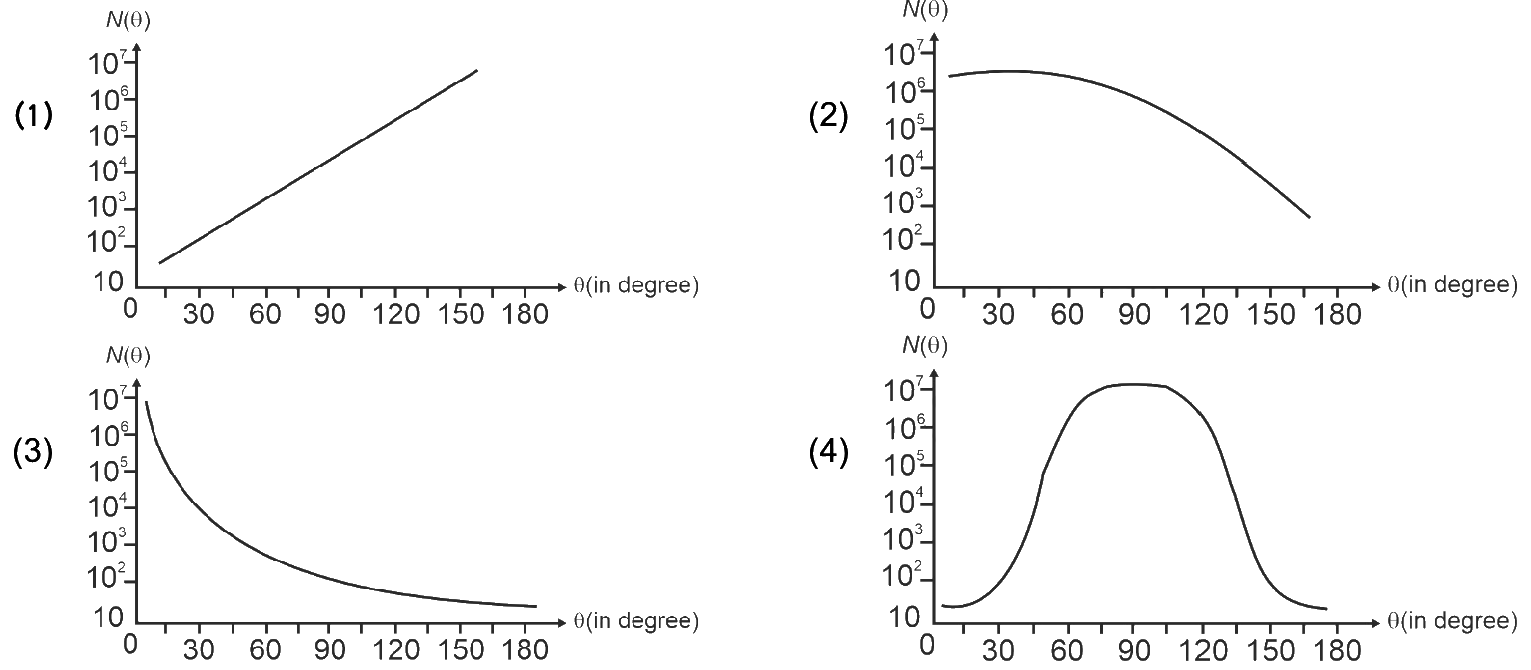
- A.N(θ) increasing with θ
- B.a broad maximum near θ≈60°
- C.N(θ) very large at small θ and falling steeply as θ increases✓
- D.a symmetric peak centred at θ≈90°
Correct Answer
(C) N(θ) very large at small θ and falling steeply as θ increases
Solution & Explanation
This is the angular distribution of α-particles in the Geiger–Marsden (Rutherford) gold-foil experiment. Rutherford's scattering formula gives the number scattered at angle θ as N(θ) ∝ 1/sin⁴(θ/2). For small θ, sin⁴(θ/2) is tiny, so N(θ) is enormous — the overwhelming majority of α-particles pass nearly straight through, deflected only slightly. As θ increases, sin⁴(θ/2) grows rapidly, so N(θ) falls off very steeply. Only a very few particles are scattered through large angles (this rare large-angle scattering is what revealed the tiny dense nucleus). So the plot is very large at small θ and decreases sharply with increasing θ. This matches answer (C): N(θ) very large at small θ, falling steeply as θ increases.
✅ We had this exact concept in our bank before the exam — Strong match, 88% match.
That's the Predicted Batch — it trains you on the exact high-probability concepts NEET repeats every year. 98% of the 2026 paper (176/180) was in our bank before the exam.
Master these concepts + 50,000+ NEET PYQs in the app — free, built for NEET 2027.
Start the Predicted Batch — Free →